Event Report
See sessions, prints, emails, popular templates, survey answers and payments, and export the report for your client.
The Report shows how an event went: how many guests came, how much was printed and emailed, which templates were most popular, survey answers, vouchers and payments. Use it during the event to keep an eye on things, and afterwards to send your client a report.
Chapters (8)
Before you start
- The Report section appears in OTHERS after the event has been saved at least once.
- The Report reads what the running event recorded. Run at least one session with Launch (F5) to see data.
Open the report
- Open the event and go to OTHERS › Report.
- Choose what to look at in Select Report.
- Choose a Range, or set your own dates in From and To.
- Read the figures, or click Export HTML / Export CSV.
Report types
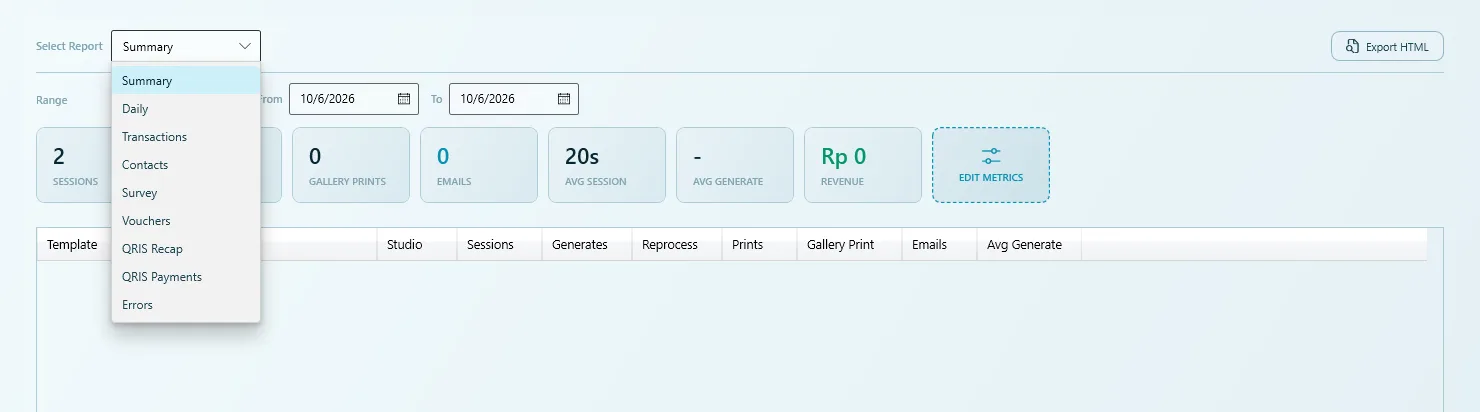
| Report | What it shows |
|---|---|
| Summary | KPI cards and a table per template for the chosen range. |
| Daily | The same figures, one row per day. Handy for events that run over several days. |
| Transactions | A journal of every guest session: start time, status, duration and more. Filter by Status. Use View Results to open the photos of a session. |
| Contacts | Names and email addresses guests entered to have their photos emailed. Only guests who chose email delivery appear here. |
| Survey | The survey answers, one row per guest and one column per question. You can pick any survey, not only the live one. See Survey. |
| Vouchers | Every voucher code with its batch, status, creation date, valid-until date, when it was used and the session that used it. See Kiosk, payment & vouchers. |
| QRIS Payments | Every QRIS payment code shown to guests, with amount, status and payment reference. |
| QRIS Recap | QRIS totals per day. Revenue is what guests paid; Collected also includes your test payments and is what the payment service settles. |
| Errors | A log of technical failures (time, source, message). Check it first when guests report a problem. |
Filters
| Filter | Options |
|---|---|
| Range | Today, Yesterday, This Week, Last Week, This Month, Last Month, All or Custom. |
| From / To | Exact start and end dates, with a calendar. |
| Status | On reports with a status column, such as Transactions: All, In Progress, Completed, Abandoned, Error, Crashed. |
For a one-day event, Today is enough. For the final report to your client, use All so nothing is left out.
KPI cards
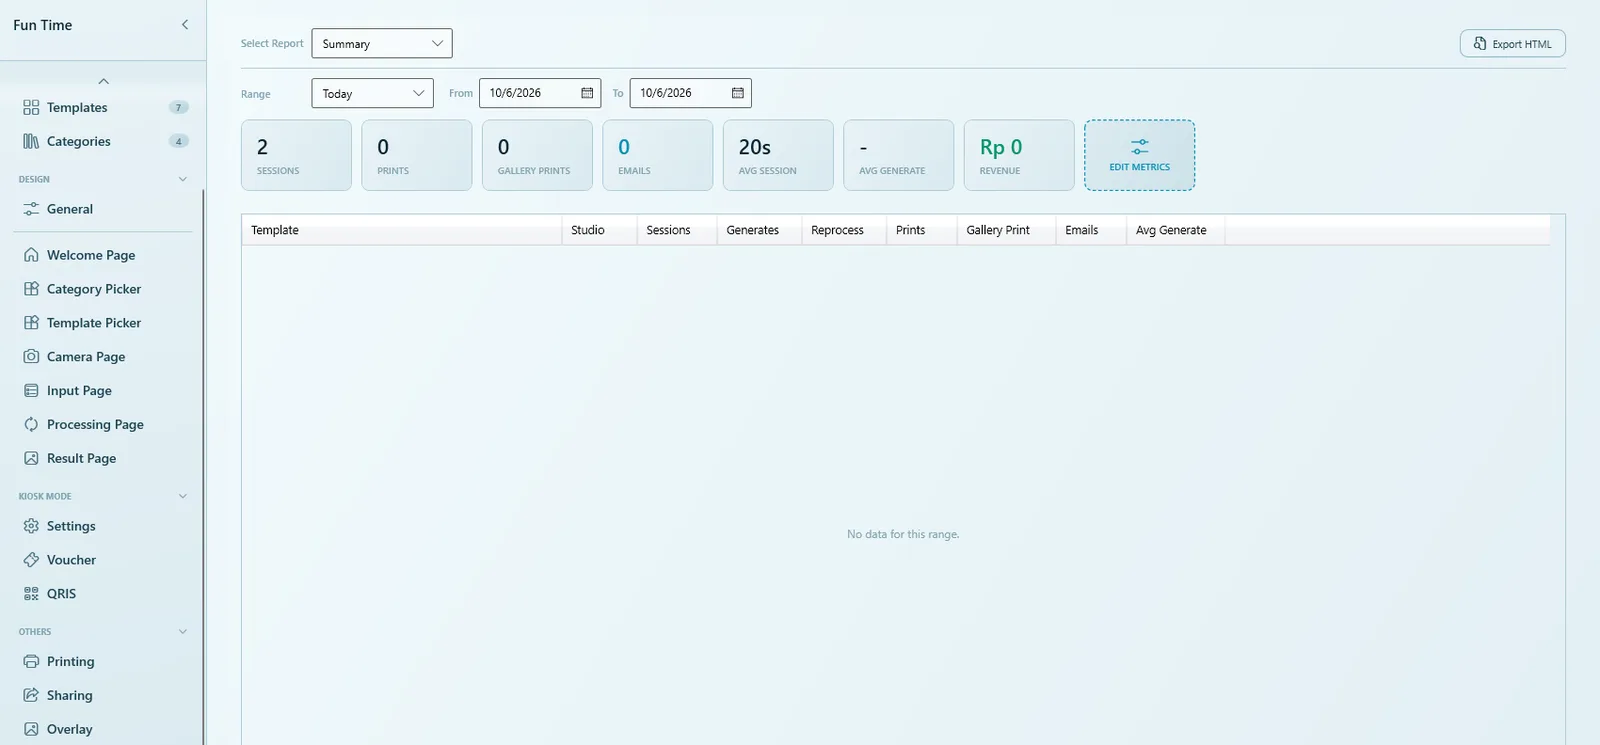
The cards at the top of the Summary give the key numbers at a glance.
| Card | Meaning |
|---|---|
| Sessions | Number of guest sessions. |
| Prints | Prints made from the guest flow at the booth. |
| Gallery Prints | Prints made from the gallery, usually by staff. |
| Emails | Result emails sent. |
| Avg Session | Average length of a guest session. |
| Avg Generate | Average processing time per result. |
| Revenue | What guests paid through QRIS. |
Click Edit Metrics to choose which cards are shown. Besides the cards above you can add Completed, Abandoned, Errors, Crashed, Generates, Reprocess, Paid Sessions and Vouchers Used. Your choice is remembered for the next visit.
The Current print counter on the Printing page is only used for print limits and can be edited by hand. The Prints figure in the Report is the real count. See Sharing & printing.
Table per template
Below the cards, the Summary lists every template with these columns: Template, Studio, Sessions, Generates, Reprocess, Prints, Gallery Print, Emails and Avg Generate.
- Most popular template: look at the Sessions column. Put it first in the Template Picker next time.
- Slowest template: look at Avg Generate. A slow template makes the queue longer at busy moments.
- Many reprocesses: guests were not happy with the first result. Check that template's settings.
Export the report
| Button | What you get |
|---|---|
| Export HTML | A web page. On the Summary it exports the complete report with every section, ready to send to your client. On other reports it exports only that table. |
| Export CSV | A spreadsheet file of the current table. Available on every report except Summary. |
Exported files are saved in the event's reports folder. When the export is done, Q-Booth asks whether to open the file right away.
Tips
- Check the Errors report and the Abandoned count during the event. A sudden rise usually points to a camera, printer or internet problem.
- Export the report before you use Reset Event. Reset deletes all transactions, counters, contacts and survey answers. Make a Backup first. See Backup & export.
- The guest contacts in the report are personal data. Share them only with the client who owns them.
Common problems
I can't find the Report section.
Save the event once. Report appears in OTHERS only after the first save.
The report says "No data for this range."
No sessions were recorded in the chosen dates. Set Range to All, or check that you are looking at the right event.
There is no Export CSV button.
Summary is made of several tables, so it only exports to HTML. Switch to another report to export a CSV.
Contacts is empty although guests used the booth.
Only guests who entered their details to have their photos emailed appear in Contacts.
Next steps
Still need help?
Our team answers on WhatsApp. Tell us your Q-Booth version and what you see on screen.